Images/date/200711
src=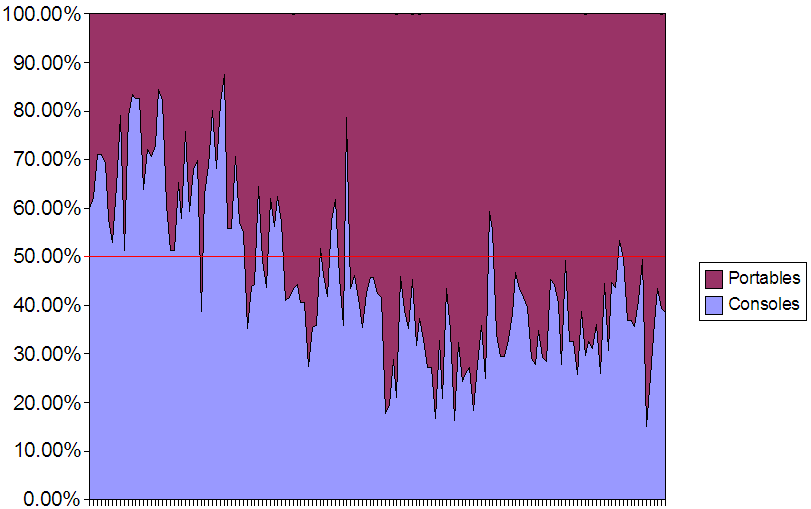
Showing the share of total software sales accounted for by the home and portable markets in Japan using Famitus's software pie chart. This probably goes back to the DS/PSP launch.
src=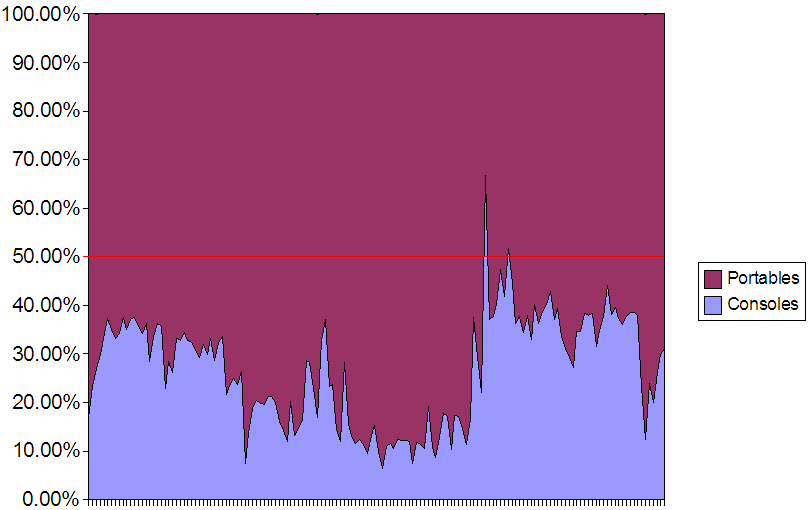
And here a representation of hardware sales (Media Create) from the same period. You can see that as PS2 slowed down the portables took more of the whole, but PS3/Wii pushed back a bit. Wii launch week is that console spike to 60-something percent.
src=
Comet Holmes reminded me of the Final Fantasy VII logo, so I combined it with text in a pseudo-FF font.
src=
I don't remember the initial source, but someplace was claiming to have doctored pictures showing what celebrities would look like with further age. It looked like they were just stretched, though, so I just further stretched it to show even older age.
src=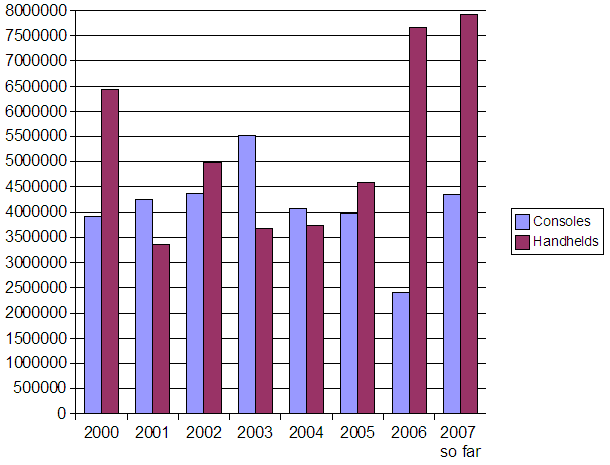
Using Famitsu hardware numbers, this shows how home console and portable sales changed from year to year. Basically showing that the percentage changes as seen a few images up were more due to portables getting huge than consoles being very down.
src=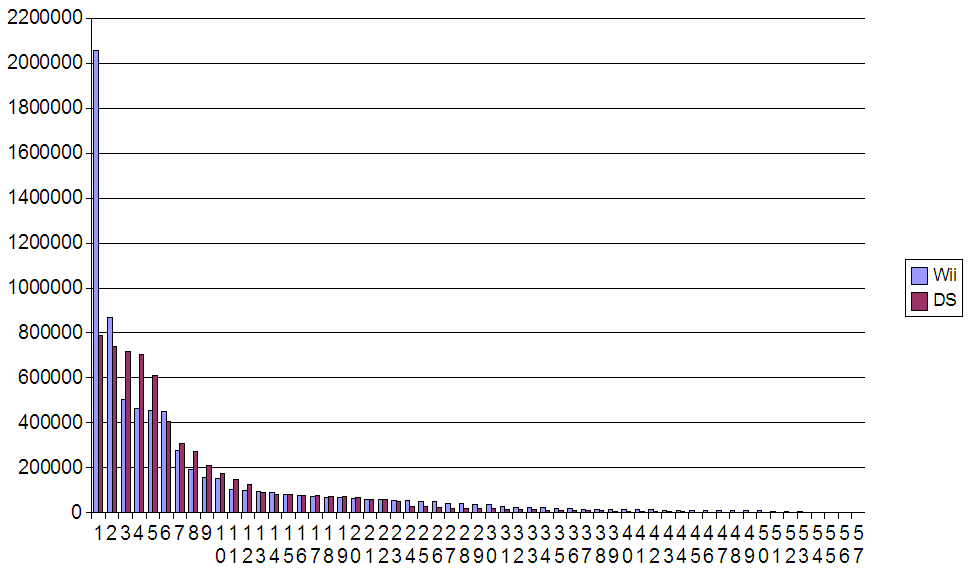
Rather than doing a "Wii versus early PS2" comparison, this is a "Wii versus early DS" comparison. Wii Sports was soooo much bigger than anything early on DS.
src=
Ha. Ha! Santa.
Why did I turn Phil Ken Sebben into Santa Claus? I do not remember.
src=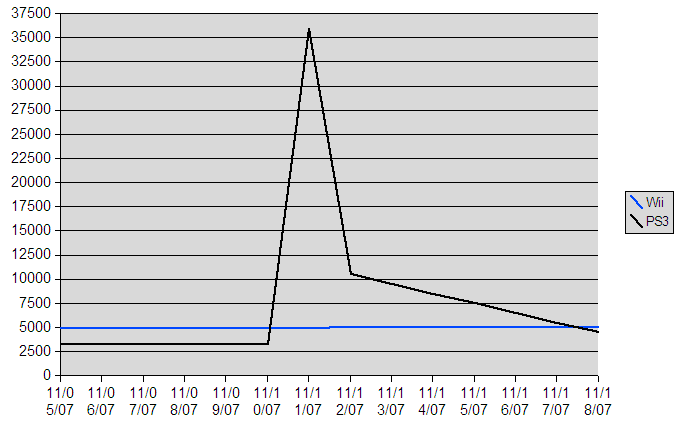
When PS3 had a boost due to new games and price drop,we had both a weekly number and a single-day number for the big day. Putting those together, it seemed like the rest of the week had to have been pretty low. I showed one way it could've gone, with the week ending in basically "normal" condition.
src=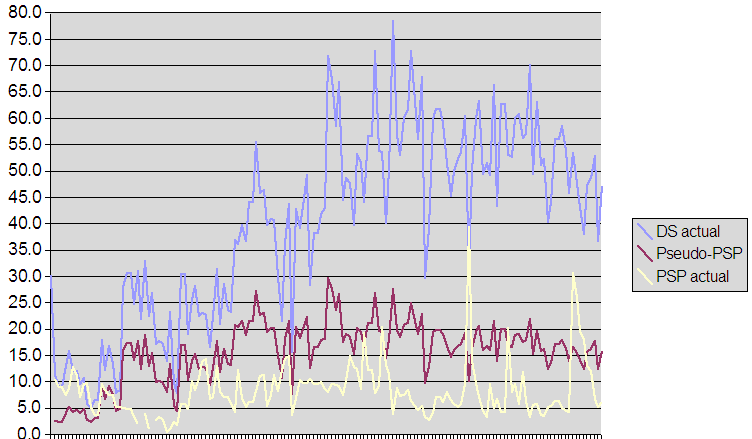
I believe this was using Famitsu's software pie yet again. First there's the actual values DS and PSP had. "Pseudo-PSP" takes the DS number and adjusts for the userbase difference.
src=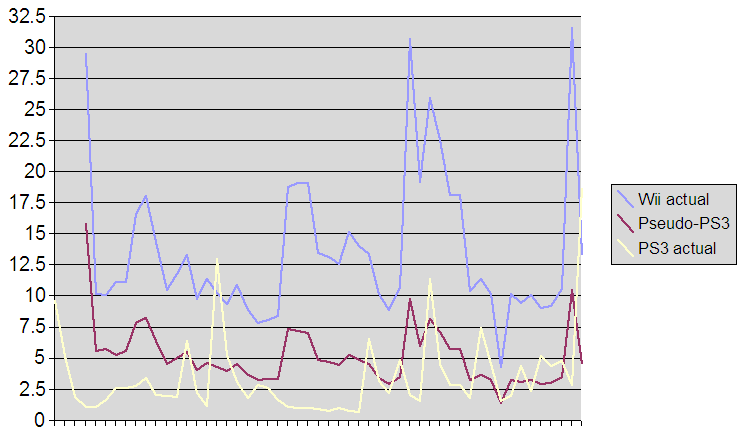
And here the same on the console side, where "Pseudo-PS3" is Wii adjusted downward for the hardware userbase difference.